On the biological plausibility of LSTMs

This is what an LSTM unit approximately looks like:

2

I say approximately because it seems to vary depending on the implementation whether the input goes through a non-linearity before getting to the gates, whether input is given to every gate, etc.

That image is from this page on Eric Yuan’s blog which has a great explanation of LSTMs, as does this page of Chris Olah’s blog.

I’m going to assume you’ve read those or something like them, and talk about the biological plausibility of LSTMs. This post began as a response to discussion in class over Thomas George’s question on this lecture page.

Just as a refresher, this is what a cartoon neuron looks like; generally we consider that the dendrites perform a weighted sum, the cell body performs some non-linear transformation of that sum, and the output is passed along the axon to other neurons (‘axon ending’ in this diagram generally ‘ends’ at a synapse with the dendrites of other neurons). Image from here.
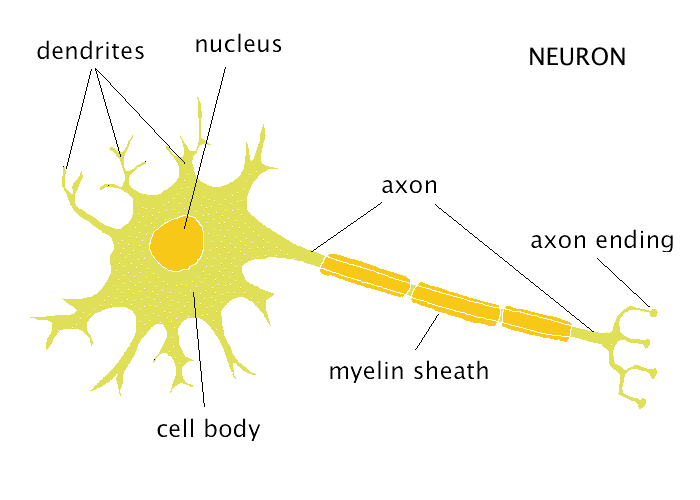
neuron

Gating in general:

I think gating is like having some connections higher in the dendritic arbor (closer to the cell body), which have a proportionally very large impact on the processing done by the cell. So you unfold each gate into a sigmoid MLP with one output to the central cell, and then an LSTM is just a specific way to nest/restrict connectivity between neurons where the neurons can have different activation functions and different degrees of effect on each other.

In this view, the different LSTM variants (peepholes, coupled gates, etc.) are just different connectivity structures – in particular, peepholes allow connections between the gate-cells, and coupled gates use the same MLP for various gates.

To look at the three gates (“neuron types”) individially:

Input gate:

This is like the central cell having input from a neuron which has had inputs from the “real” input neurons x(t), and also from the “output” of the previous state h(t-1).

For example, this could be the case of a cell in the LGN (lateral geniculate nucleus) which receives information about light levels from sensory neurons in the retina, and also feedback information from the primary visual cortex.

Forget gate:

This is like the central cell having input from a neuron which looks at the same stuff the input gate does, and also has input from the central cell.

In class we talked about a differential formula for how voltage changes across the membrane:

\displaystyle \frac{dV_i}{dt} = \sum_{j} w_{ij} x_{j}(t) - V_i

where Vi is like an input to one’s self where the value depends on both the input and on the previous value (if you were to discretize time). In other words, makes the cell inertial to changing its value. I see this like giving a bias to the ‘central’ cell in this unfolded LSTM.

The above formula should actually be

\displaystyle \tau\frac{dV_i}{dt} = \sum_{j} w_{ij} x_{j}(t) - V_i

where \tau is a time constant. We talked in class about this time constant not being fixed in LSTMs, and whether or not this is biologically plausible. There are cells in the hippocampus whose spiking rates appear to modulate our perception of time, and these correlations are not fixed.

To continue the previous example, we can imagine that the forget gate is a cell in the LGN connected to the input gate cell I describe above, and which also has connections to the hippocampus and to the central cell. This paper talks about hippocampal connections to the LGN.

Output gate:

This is like the central cell having input from a neuron which looks at the same stuff as the input gate does, and attaches to the central cell not in the dendritic arbor but on the axon.

This paper talks about a region of hippocampal cells in particular having this structure (well, they observe that many axons in this area derive from dendrites, which amounts to the same thing).
First assignment: 1-hidden-layer network on MNIST

I was hoping there would be an easy way to embed Jupyter notebooks in wordpress, but I haven’t found it.

So instead, I’ll try to duplicate some visual parts of the notebooks here, but mostly talk kind of meta about the class and the tools I’m using and problems I’ve run in to, while the actual work (notebooks with diagrams and derivations, code, results etc.) will all be in the gihub repo.

This is the first section of my notebook for this assignment. I used draw.io for the diagram – it’s a great web-based tool for drawings and diagrams. I’ve found Michael Neilsen’s online deep learning textbook really helpful.

Basics

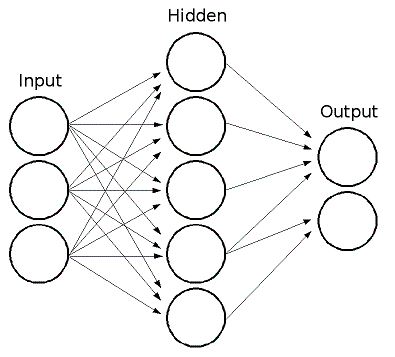
I find diagrams really helpful to keep the dimensions of everything straight. This is a typical one-hidden-layer network:

mlp

And this is kind of a functional diagram of the network described in the assignment. Chris Beckham started doing something like this and I found it really helpful for making the connection between the loss derivatives done “on paper”, and the actual matrices and functions we need to code.

one-hidden-layer-mlp-matrices

Where:

Input layer:

x is the n by p input vector

Hidden layer:

W is the m by n weight matrix
b is the m by p bias vector
h’ = Wx+b is the m by p vector of preactivations
h = f(h’) is the m by p vector of activations f is the activation function (often σ, the sigmoid, or tanh)

Output layer:

V is the q by m weight matrix
c is the m by p bias vector
y’ = Vh+c is the q by p vector of preactivations y = s(h’) is the q by p vector of activations s is the activation function (often softmax)

And:

n is the number of input units
p is usually 1, i.e. the input is a vector not a matrix
m is the number of hidden units q is the number of output units
Bold denotes vectors/matrices
h’ and y’, the preactivations, are often denoted z
h and y, the activations, are often denoted a or o

Getting set up for research

I’m creating this blog for Yoshua Bengio‘s deep learning class, IFT6266, offered at Université de Montréal in the winter semester of 2016.

We don’t have coding assignments yet, but I thought I’d share some of the tools and things that I use and/or have heard are useful, in preparation for actually using them later in the semester. Any comments, complementary software or workflows, etc. all welcome!

Python

Python is the main language I’ve used for any project whose description includes the words “data”, “parse”, “scrape”, or “quick”.  If you’re just getting started, the Anaconda package has a bunch of useful libraries (including numpy, scipy, scikit-learn etc.). I’ve mostly used iPython to code in python – it gives you an enhanced shell environment that’s pretty useful in a lot of ways. Since the last big python project I’ve done, I guess iPython has been merging with Jupyter, which is kind of like an even GUI-er layer over python/iPython that lets you merge research notes and code bits (including equations and stuff). I’ll be trying to use that for this semester.

Another reason to use python is Theano, a library developed at UdeM for deep learning. It does automatic differentiation, which is really cool. I’ve used Theano pretty out-of-the-box, and the tutorials are great, but they’re like tiny boats in a very large ocean … I’m going to try to understand a lot more about how Theano works this semester and hopefully use it in a more sophisticated way.

R

My background is in biology/ecology, so R is one of the first coding environments I ever encountered. The documentation for different packages ranges from cryptically sparse to overwhelmingly comprehensive, but most of the popular ones are fortunately somewhere in between. RStudio is a good IDE package (I linked to the website, but I’ve only ever installed it through R’s package manager). R can be great for running stats and generating plots – it’s what I’m used to using, but I’ll be trying to figure out how to do some of the things I usually do in R in python this semester.

Weka

I was introduced to Weka in a data mining course, and because it’s java-based I think it’s used pretty extensively in industry. It’s really great for visualizing and exploring a dataset, and running preliminary analyses before coding something more custom. Again, I think I’ll try to replicate some of the things I’ve done in Weka before in python for this class, but for cross-validation, and for seeing 16 plots at once … we’ll see how it goes 🙂

Matlab/Octave

Most of my thesis research was done in Matlab. I installed Octave at first (the open-source alternative) but had trouble getting a couple packages to work. It looks like the newest version has a GUI, so maybe I’ll try using that the next time I need to do something in Matlab. I’ve used the very well-documented matconvnet package for convolutional neural networks – it made it really easy to use CUDA libraries for GPU processing.